

Andy Schectman Miles Franklin
President of Miles Franklin Precious Metals Investments. He is a prominent expert on the precious metals market and a frequent speaker on gold and silver investments.
| Grade | Contained Metal | ||||||||||||
|---|---|---|---|---|---|---|---|---|---|---|---|---|---|
| Texas District Deposits | Tonners (MT) | AgEq (g/t) | Ag (g/t) | Au (g/t) | Zn (%) | Pb (%) | Cu (%) | AgEq (Moz) | Ag (Moz) | Au (koz) | Zn (kt) | Pb (kt) | Cu (kt) |
| Twin Hills Oxide/Transition | |||||||||||||
| Indicated | 0.91 | 53 | 50 | 0.05 | - | - | - | 1.5 | 1.5 | 1 | - | - | - |
| Inferred | 1.18 | 37 | 36 | 0.03 | - | - | - | 0.2 | 0.2 | - | - | - | |
| Subtotal | 1.08 | 50 | 48 | 0.04 | - | - | - | 1.8 | 1.7 | 1 | - | - | - |
| Twin Hills Sulphide | |||||||||||||
| Indicated | 3.53 | 55 | 51 | 0.07 | 6.3 | 5.8 | 7 | ||||||
| Inferred | 1.49 | 46 | 43 | 0.05 | 2.2 | 2.1 | 3 | ||||||
| Subtotal | 5.02 | 53 | 49 | 0.06 | 8.5 | 7.8 | 10 | ||||||
| Mt Gunyan Oxide/Transition | |||||||||||||
| Indicated | 2.40 | 43 | 40 | 0.03 | 0.11 | 0.10 | - | 3.3 | 3.1 | 3 | 2.6 | 2.4 | - |
| Inferred | 1.47 | 38 | 35 | 0.04 | 0.12 | 0.18 | - | 1.8 | 1.7 | 2 | 1.7 | 2.7 | - |
| Subtotal | 3.87 | 41 | 39 | 0.03 | 0.11 | 0.13 | - | 5.1 | 4.8 | 5 | 4.3 | 5.0 | - |
| Mt Gunyan Sulphide | |||||||||||||
| Indicated | - | - | - | - | - | - | - | - | - | - | - | - | - |
| Inferred | 0.62 | 39 | 36 | 0.03 | 0.11 | 0.14 | - | 0.8 | 0.7 | 1 | 0.7 | 0.9 | - |
| Subtotal | 0.62 | 39 | 36 | 0.03 | 0.11 | 0.14 | - | 0.8 | 0.7 | 1 | 0.7 | 0.9 | - |
| Silver Spur Oxide | |||||||||||||
| Indicated | 0.03 | 78 | 67 | 0.08 | 1.53 | 0.48 | 0.05 | 0.1 | 0.1 | <1 | 0.4 | 0.1 | <0.1 |
| Inferred | 0.02 | 89 | 80 | 0.10 | 1.22 | 0.57 | 0.13 | 0.1 | 0.1 | <1 | 0.3 | 0.1 | <0.1 |
| Subtotal | 0.05 | 84 | 74 | 0.09 | 1.38 | 0.53 | 0.09 | 0.1 | 0.1 | <1 | 0.7 | 0.3 | <0.1 |
| Silver Spur Sulphide | |||||||||||||
| Indicated | 0.17 | 201 | 64 | 0.06 | 2.53 | 0.99 | 0.10 | 1.1 | 0.3 | <1 | 4.2 | 1.7 | 0.2 |
| Inferred | 0.45 | 148 | 49 | 0.06 | 1.91 | 0.59 | 0.09 | 2.1 | 0.7 | <1 | 8.6 | 2.6 | 0.4 |
| Subtotal | 0.02 | 162 | 53 | 0.06 | 2.08 | 0.70 | 0.09 | 3.2 | 1.0 | <1 | 12.8 | 4.3 | 0.6 |
| Texas District Totals | |||||||||||||
| Oxide-Transition Total | 5.00 | 44 | 41 | 37 | 0.10 | 0.11 | 0.00 | 7.0 | 6.6 | 6 | 5.0 | 5.3 | 0 |
| Sulphide Total | 6.26 | 62 | 47 | 55 | 0.22 | 0.08 | 0.01 | 12.5 | 9.5 | 11 | 13.5 | 5.2 | 0.6 |
| Texas District Total | 11.26 | 54 | 45 | 0.04 | 0.16 | 0.09 | 0.01 | 19.5 | 16.2 | 16 | 18.5 | 10.5 | 0.6 |
Note: The Twin Hills, Mt Gunyan and Silver Spur MRES use a 25 g/t Ag equivalent (AgEq) cut-off. The AgEq formula used the following processing recoveries: Twin Hills Ag 78%, Au 77%; Mt Gunyan oxide Ag 89%, Au 78%, Zn 12%; Mt Gunyan sulphide Ag 78%, Au 77%, Zn 16%; Silver Spur Oxide Ag 91%, Zn 20%; Silver Spur Sulphide Ag 69%, Zn 93%, Pb 64%. AgEq was calculated using the following formulas: Twin Hills (AgEq) = Ag (g/t)+65.22* Au g/t, Mt Gunyan Oxide AgEq = Ag (g/t) +57.91 * Au (g/t)+4.49* Zn(%), Mt Gunyan Sulphide AgEq= Ag (g/t)+65.22* Au (g/t)+6.84* Zn(%), Silver Spur Oxide AgEq = Ag (g/t) +7.3* Zn(%), Silver Spur Sulphide AgEq= Ag (g/t)+44.92 Zn(%) + 22.67* Pb (%) based on metal prices and metal recoveries into concentrate. Whilst the estimated contained gold for Silver Spur is shown here, it has not been included in the total gold ounces in the reported Mineral Resource as the quantity of contained gold is considered immaterial to the Mineral Resource. For all deposits the metal price assumptions used, where applicable, in the AgEq formula at an exchange rate of US$0.73 were; Ag price A$38/oz, Au price A$2,534/oz, Zn price A$4,110/t, Pb price A$3,014/t. Totals may not add up due to rounding.
| Cut off AgEq (g/t) | Tonners (Mt) | AgEq (g/t) | Ag (g/t) | Au (g/t) | Zn (%) | Pb (%) | Cu (%) | AgEq (Moz) | Ag (Moz) | Au (koz) | Zn (kt) | Pb (kt) | Cu (kt) |
|---|---|---|---|---|---|---|---|---|---|---|---|---|---|
| 0 | 0.80 | 132 | 46 | - | 1.82 | 0.58 | 0.08 | 3.4 | 1.2 | - | 14.6 | 4.7 | 0.6 |
| 10 | 0.71 | 148 | 52 | - | 1.97 | 0.65 | 0.09 | 3.4 | 1.2 | - | 13.9 | 4.6 | 0.6 |
| 20 | 0.68 | 154 | 54 | - | 2.01 | 0.68 | 0.09 | 3.4 | 1.2 | - | 13.5 | 4.6 | 0.6 |
| 25 | 0.66 | 156 | 54 | - | 2.03 | 0.69 | 0.09 | 3.3 | 1.2 | - | 13.5 | 4.6 | 0.6 |
| 30 | 0.65 | 159 | 55 | - | 2.06 | 0.70 | 0.09 | 3.3 | 1.2 | - | 13.4 | 4.5 | 0.6 |
| 40 | 0.63 | 164 | 57 | - | 2.11 | 0.72 | 0.10 | 3.3 | 1.2 | - | 13.2 | 4.5 | 0.6 |
| 50 | 0.59 | 171 | 60 | - | 2.19 | 0.76 | 0.10 | 3.2 | 1.1 | - | 12.9 | 4.5 | 0.6 |
| 60 | 0.55 | 181 | 64 | - | 2.28 | 0.81 | 0.11 | 3.2 | 1.1 | - | 12.4 | 4.4 | 0.6 |
| 70 | 0.51 | 188 | 67 | - | 2.36 | 0.86 | 0.11 | 3.1 | 1.1 | - | 12.1 | 4.4 | 0.6 |
| 80 | 0.48 | 197 | 70 | - | 2.45 | 0.91 | 0.12 | 3.0 | 1.1 | - | 11.7 | 4.3 | 0.5 |
| 90 | 0.44 | 205 | 73 | - | 2.55 | 0.95 | 0.12 | 2.9 | 1.0 | - | 11.3 | 4.2 | 0.5 |
| 100 | 0.42 | 213 | 76 | - | 2.63 | 0.98 | 0.12 | 2.8 | 1.0 | - | 10.9 | 4.1 | 0.5 |
| 110 | 0.38 | 222 | 79 | - | 2.74 | 1.03 | 0.13 | 2.7 | 1.0 | - | 10.4 | 3.9 | 0.5 |
| 120 | 0.35 | 232 | 83 | - | 2.84 | 1.08 | 0.13 | 2.6 | 0.9 | - | 9.9 | 3.8 | 0.5 |
| Cut off AgEq (g/t) | Tonners (Mt) | AgEq (g/t) | Ag (g/t) | Au (g/t) | Zn (%) | Pb (%) | Cu (%) | AgEq (Moz) | Ag (Moz) | Au (koz) | Zn (kt) | Pb (kt) | Cu (kt) |
|---|---|---|---|---|---|---|---|---|---|---|---|---|---|
| 0 | 116.20 | 6 | 5 | 0.01 | 0.06 | 0.03 | - | 23.3 | 20.4 | 30 | 64.8 | 33.2 | - |
| 10 | 22.85 | 19 | 18 | 0.02 | 0.11 | 0.07 | - | 14.2 | 13.0 | 13 | 24.6 | 16.6 | - |
| 20 | 6.44 | 35 | 33 | 0.03 | 0.10 | 0.12 | - | 7.3 | 6.8 | 6 | 6.6 | 7.4 | - |
| 25 | 4.50 | 41 | 38 | 0.04 | 0.11 | 0.13 | - | 5.9 | 5.5 | 5 | 5.0 | 5.9 | - |
| 30 | 3.10 | 47 | 44 | 0.05 | 0.12 | 0.15 | - | 4.7 | 4.4 | 5 | 3.8 | 4.6 | - |
| 40 | 1.47 | 61 | 56 | 0.08 | 0.16 | 0.15 | - | 2.9 | 2.6 | 4 | 2.3 | 2.2 | - |
| 50 | 0.77 | 76 | 69 | 0.11 | 0.20 | 0.16 | - | 1.9 | 1.7 | 3 | 1.5 | 1.2 | - |
| 60 | 0.43 | 93 | 83 | 0.15 | 0.24 | 0.17 | - | 1.3 | 1.2 | 2 | 1.0 | 0.7 | - |
| 70 | 0.26 | 113 | 101 | 0.18 | 0.21 | 0.17 | - | 0.9 | 0.8 | 1 | 0.5 | 0.4 | - |
| 80 | 0.19 | 127 | 114 | 0.20 | 0.20 | 0.17 | - | 0.8 | 0.7 | 1 | 0.4 | 0.3 | - |
| 90 | 0.13 | 145 | 130 | 0.24 | 0.21 | 0.17 | - | 0.6 | 0.6 | 1 | 0.3 | 0.2 | - |
| 100 | 0.09 | 165 | 151 | 0.23 | 0.23 | 0.16 | - | 0.5 | 0.5 | 1 | 0.2 | 0.2 | - |
| 110 | 0.07 | 184 | 171 | 0.20 | 0.26 | 0.16 | - | 0.4 | 0.4 | 0 | 0.2 | 0.1 | - |
| 120 | 0.06 | 196 | 184 | 0.19 | 0.28 | 0.15 | - | 0.4 | 0.4 | 0 | 0.2 | 0.1 | - |
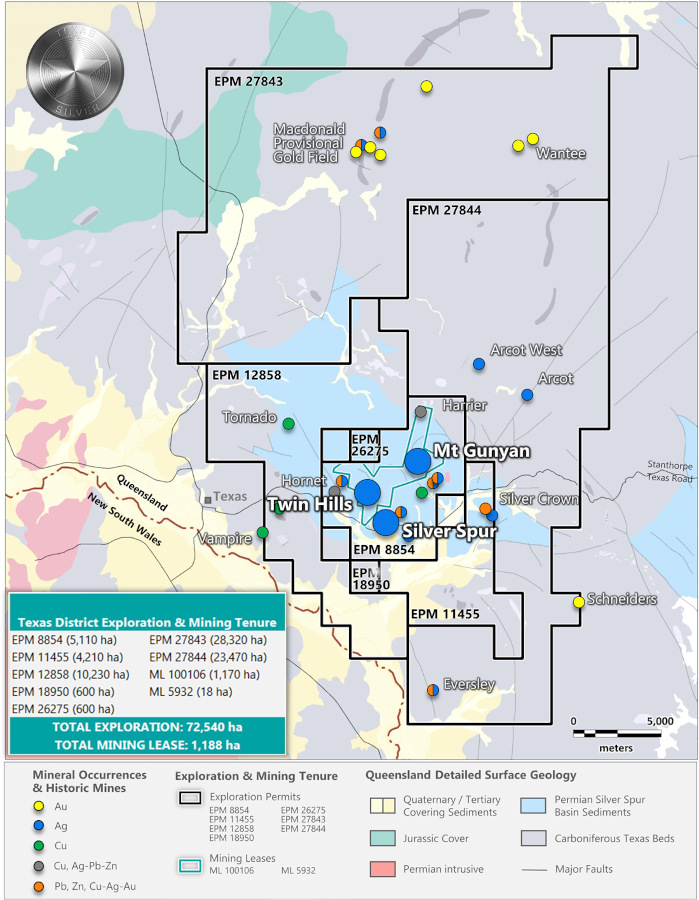
Texas Silver has a acquired the following tenements that make up the Texas Silver Project in Queensland.
| Tenure ID | Project Name | Granted |
|---|---|---|
| EPM 11455 | Dumaresq | 1/04/2023 |
| EPM 12858 | Oakey Creek | 10/08/2023 |
| EPM 18950 | Texas South West | 31/05/2021 |
| EPM 26275 | Texas Silver | 27/02/2022 |
| EPM2 7843 | Macdonald | 18/10/2021 |
| EPM 27844 | Arcot | 18/10/2021 |
| EPM 8854 | Texas | 8/07/2023 |
| ML 100106 | Texas | 1/10/2017 |
| ML5 932 | Silver Spur | 5/06/2016 |
Thomson Resources Ltd. ASX Announcement of 1 March 2022

Gather detailed records of all past drilling and exploration activities, including dates, methods and locations.


Engage a professional appraiser or geologist to validate and refine the valuation based on current industry standards and market conditions.
Through this acquisition, Texas Silver has secured comprehensive historical drill data and associated analysis from over 731 drilling sites, totaling a depth of 41,952 meters. This data, collected across multiple exploration programs, will be meticulously modelled to identify the best potential future exploration prospects. Many of the leases have been the subject of early stage, and advanced exploration. As such, over 20 areas of interest have been identified as containing indications of high-grade silver and copper, with additional early indications of gold, lead and other metals on the critical minerals list that need to be investigated.
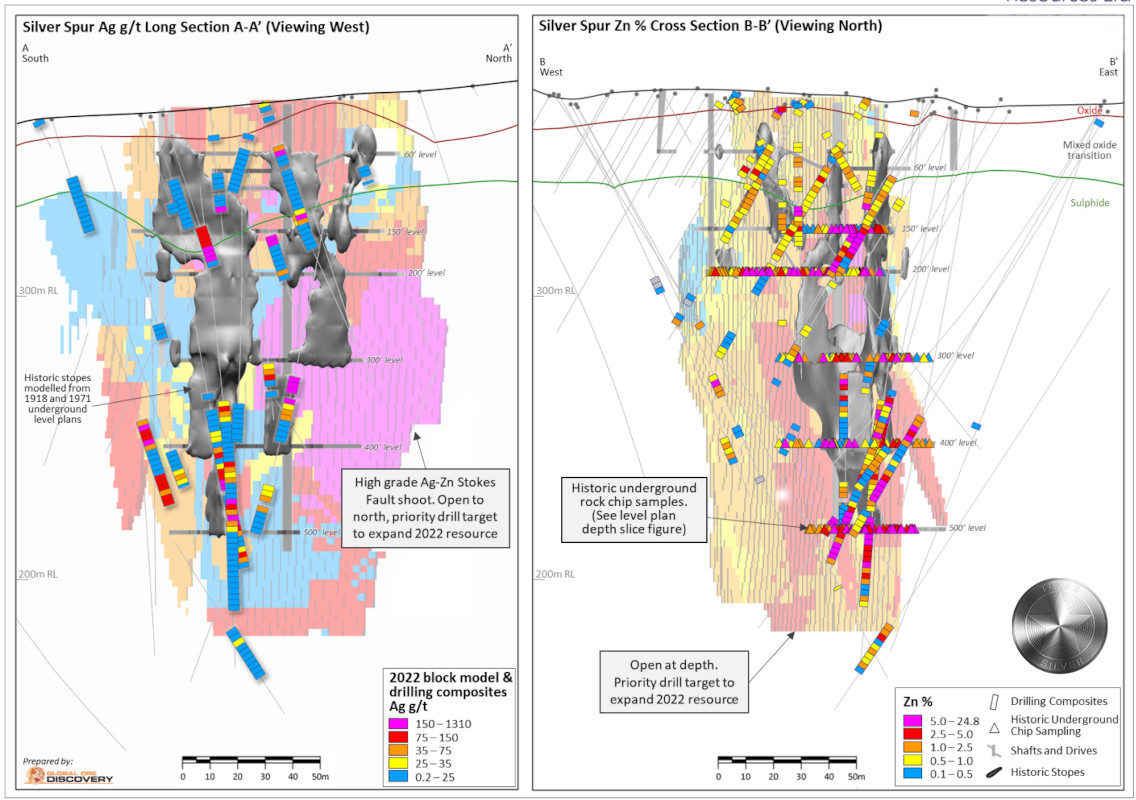
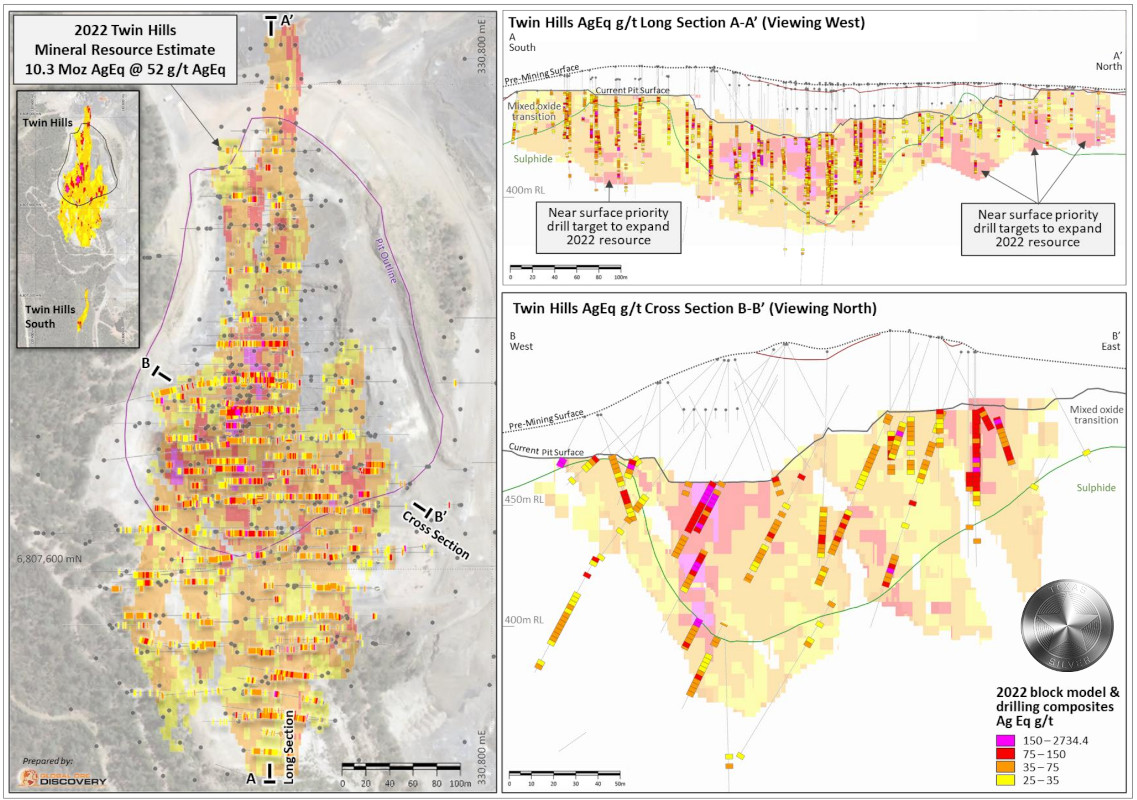
The JORC 2012 Mineral Resource Estimates (MREs) for the Silver Spur, Twin Hills, and Mt Gunyan deposits total an aggregate of 19.5 Moz AgEq at 54 g/t AgEq.
Reference ASX Announcement of 1 March 2022 Thomson Resources Ltd. – “19.5 Moz Silver Equivalent Indicated and Inferred Mineral Resource Estimate for the Texas Silver District.”
The majority of holes and meterage are from open hole percussion drilling, which may impact sample quality. Assay methods used include aqua regia digest with AA or ICP finish, which, while potentially partial, may be appropriate for heap leaching.
Both models use a 20g/t Ag grade threshold for interpretation, though a high-grade domain at 40g/t Ag may have been used in 2016. The threshold being close to the cut-off grade may be inappropriate.
2016 - "Some 200 meters vertically from surface"
2022 - "Extending to 150 meters depth" but also mentions a "200 meters depth limit below surface," which is ambiguous.
| Grade | Contained Metal | ||||||||||||
|---|---|---|---|---|---|---|---|---|---|---|---|---|---|
| Texas District Deposits | Tonners (MT) | AgEq (g/t) | Ag (g/t) | Au (g/t) | Zn (%) | Pb (%) | Cu (%) | AgEq (Moz) | Ag (Moz) | Au (koz) | Zn (kt) | Pb (kt) | Cu (kt) |
| Twin HIlls ML 100106 | |||||||||||||
| Indicated | 4.43 | 55 | 51 | 0.06 | - | - | - | 7.8 | 7.3 | 9 | - | - | - |
| Inferred | 1.67 | 45 | 42 | 0.05 | - | - | - | 2.4 | 2.2 | 3 | - | - | - |
| Subtotal | 6.10 | 52 | 48 | 0.06 | - | - | - | 10.3 | 9.5 | 11 | - | - | - |
| Mount Gunyan ML 100106 | |||||||||||||
| Indicated | 2.40 | 43 | 40 | 0.03 | 0.11 | 0.10 | - | 3.3 | 3.1 | 3 | 2.6 | 2.4 | - |
| Inferred | 2.09 | 39 | 36 | 0.04 | 0.12 | 0.17 | - | 2.6 | 2.4 | 3 | 2.4 | 3.6 | - |
| Subtotal | 4.5 | 41 | 38 | 0.04 | 0.11 | 0.13 | - | 5.9 | 5.5 | 5 | 5.0 | 5.9 | - |
| Silver Spur ML | |||||||||||||
| Indicated | 0.19 | 184 | 65 | 0.6 | 2.40 | 0.92 | 0.09 | 1.1 | 0.4 | < 1 | 4.6 | 1.8 | 0.2 |
| Inferred | 0.47 | 145 | 50 | 0.6 | 1.88 | 0.59 | 0.09 | 2.2 | 0.8 | < 1 | 8.9 | 2.8 | 0.4 |
| Subtotal | 0.66 | 156 | 54 | 0.6 | 2.03 | 0.69 | 0.09 | 3.3 | 1.2 | < 1 | 13.5 | 4.6 | 0.6 |
| Total Indicated | 7.02 | 54 | 48 | 0.05 | 0.10 | 0.06 | 0.00 | 12.2 | 10.8 | 12 | 7.2 | 4.2 | 0.2 |
| Total Inferred | 4.23 | 53 | 40 | 0.04 | 0.27 | 0.15 | 0.01 | 7.2 | 5.4 | 6 | 11.3 | 6.4 | 0.2 |
| Texas District Total | 11.26 | 54 | 45 | 0.04 | 0.16 | 0.09 | 0.01 | 19.5 | 16.2 | 16 | 18.5 | 10.5 | 0.6 |
The Texas Prospects have yielded rock samples with significant AgEQ (Silver Equivalent) values, showcasing the potential of the region’s mineral resources. These results highlight the area’s prospectively and underscore its potential for further exploration and development. The data provides a strong foundation for advancing the Silver Star Project and supports our strategic focus on unlocking the site’s value.

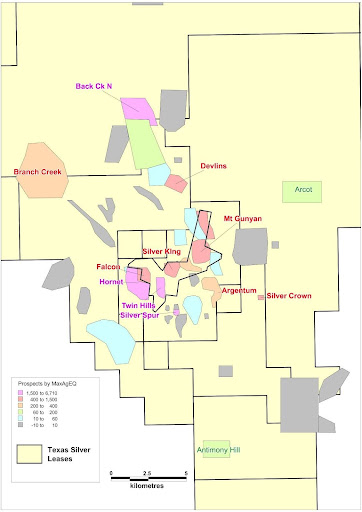
The Silver Star Region, located within Queensland’s renowned Granite Belt, is a highly prospective and mineral-rich geological province. This region boasts diverse geology, including granitic intrusions, volcanic sequences, and structurally complex terrains, which have historically hosted significant deposits of precious metals like silver, gold, and associated minerals. The area’s favourable tectonic setting and proximity to major fault systems create ideal conditions for hydrothermal activity, resulting in extensive ore body formation.
This exceptional opportunity includes:
Applications have been lodged to extend our exploration permits by a additional 1,880 square kilometres (188,000 hectares / 464,642 acres), further enhancing the area’s potential for resource development and investment.
With a combination of approved permits, a strategic location, and ambitious expansion plans, the Silver Star Region represents a unique opportunity to capitalise on Queensland’s thriving mining sector.
Contact us today to explore this unparalleled investment opportunity.
The Texas Prospects have yielded rock samples with significant AgEQ (Silver Equivalent) values, showcasing the potential of the region’s mineral resources. These results highlight the area’s prospectively and underscore its potential for further exploration and development. The data provides a strong foundation for advancing the Silver Star Project and supports our strategic focus on unlocking the site’s value.
These applications reflect our strategic focus on areas with proven potential, strengthening our position and increasing our capacity for future resource development.
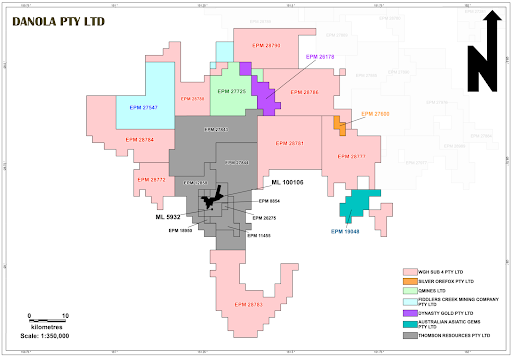
Above is a map of the Mines Department showing the new areas (highlighted in orange) we have applied for.
Collect detailed records of drilling and exploration activities, including dates, methods, and specific locations for the 731 sites.
Labour Costs: Determine the wages paid to geologists, engineers, drill operators, and support staff.Equipment Costs: Assess the rental or purchase costs for drilling rigs, vehicles, and other necessary equipment.Material Costs: Include costs for drilling fluids, bits, and other consumables.Contractor Services: Calculate fees paid to any third-party drilling or exploration service providers.
Use historical cost indexes to adjust past costs to present-day values. For example, if the average cost per meter drilled in the past was $150, adjusting for inflation might increase this to $320 per metre today.
Permitting and Regulatory Costs: Include costs associated with obtaining necessary permits and complying with regulations.Logistical Support: Consider costs for transportation, accommodation, and sustenance for staff.Administrative Expenses: Account for overhead costs related to the exploration project
Direct Drilling Costs: $12,585,600.Indirect Costs: $2,517,120.Total Estimated Cost: $15,102,720.
Note: These recalculated figures provide a comprehensive overview of the drilling costs, taking into account both direct and indirect expenses.
Current market price of silver: $42 AUD per ounce.
Current resources to JORC 19.5 million ounces. Reduce the net resources allowing for a 50% recovery rate (recovery rate is what is captured during production).Multiply the net in-ground resources by the market price of silver.
Use historical cost indexes to adjust past costs to present-day values. For example, if the average cost per meter drilled in the past was $150, adjusting for inflation might increase this to $320 per metre today.
Subtract the total extraction costs from the gross value to get the net value of the resources.
Apply a discount rate to account for the time value of money, operational risks, and uncertainties.Contingency factor of 10%.
Gross Value of the net Resources: 409.5 million AUD.Total Extraction Cost with Contingency: 375.375 million AUD.Net Value After Extraction Costs: 34.125 million AUD.

| Grade | Contained Metal | ||||||||||||
|---|---|---|---|---|---|---|---|---|---|---|---|---|---|
| Texas District Deposits | Tonners (MT) | AgEq (g/t) | Ag (g/t) | Au (g/t) | Zn (%) | Pb (%) | Cu (%) | AgEq (Moz) | Ag (Moz) | Au (koz) | Zn (kt) | Pb (kt) | Cu (kt) |
| Twin HIlls ML 100106 | |||||||||||||
| Indicated | 4.43 | 55 | 51 | 0.06 | - | - | - | 7.8 | 7.3 | 9 | - | - | - |
| Inferred | 1.67 | 45 | 42 | 0.05 | - | - | - | 2.4 | 2.2 | 3 | - | - | - |
| Subtotal | 6.10 | 52 | 48 | 0.06 | - | - | - | 10.3 | 9.5 | 11 | - | - | - |
| Mount Gunyan ML 100106 | |||||||||||||
| Indicated | 2.40 | 43 | 40 | 0.03 | 0.11 | 0.10 | - | 3.3 | 3.1 | 3 | 2.6 | 2.4 | - |
| Inferred | 2.09 | 39 | 36 | 0.04 | 0.12 | 0.17 | - | 2.6 | 2.4 | 3 | 2.4 | 3.6 | - |
| Subtotal | 4.5 | 41 | 38 | 0.04 | 0.11 | 0.13 | - | 5.9 | 5.5 | 5 | 5.0 | 5.9 | - |
| Silver Spur ML | |||||||||||||
| Indicated | 0.19 | 184 | 65 | 0.6 | 2.40 | 0.92 | 0.09 | 1.1 | 0.4 | < 1 | 4.6 | 1.8 | 0.2 |
| Inferred | 0.47 | 145 | 50 | 0.6 | 1.88 | 0.59 | 0.09 | 2.2 | 0.8 | < 1 | 8.9 | 2.8 | 0.4 |
| Subtotal | 0.66 | 156 | 54 | 0.6 | 2.03 | 0.69 | 0.09 | 3.3 | 1.2 | < 1 | 13.5 | 4.6 | 0.6 |
| Total Indicated | 7.02 | 54 | 48 | 0.05 | 0.10 | 0.06 | 0.00 | 12.2 | 10.8 | 12 | 7.2 | 4.2 | 0.2 |
| Total Inferred | 4.23 | 53 | 40 | 0.04 | 0.27 | 0.15 | 0.01 | 7.2 | 5.4 | 6 | 11.3 | 6.4 | 0.2 |
| Texas District Total | 11.26 | 54 | 45 | 0.04 | 0.16 | 0.09 | 0.01 | 19.5 | 16.2 | 16 | 18.5 | 10.5 | 0.6 |
Reference ASX Announcement of 1 March 2022 Thomson Resources Ltd. – “19.5 Moz Silver Equivalent Indicated and Inferred Mineral Resource Estimate for the Silver Star District.