| Grade | Contained Metal | ||||||||||||
|---|---|---|---|---|---|---|---|---|---|---|---|---|---|
| Texas District Deposits | Tonnes (MT) | AgEq (g/t) | Ag (g/t) | Au (g/t) | Zn (%) | Pb (%) | Cu (%) | AgEq (Moz) | Ag (Moz) | Au (koz) | Zn (kt) | Pb (kt) | Cu (kt) |
| Twin Hills Oxide/Transition | |||||||||||||
| Indicated | 0.91 | 53 | 50 | 0.05 | - | - | - | 1.5 | 1.5 | 1 | - | - | - |
| Inferred | 1.18 | 37 | 36 | 0.03 | - | - | - | 0.2 | 0.2 | - | - | - | |
| Subtotal | 1.08 | 50 | 48 | 0.04 | - | - | - | 1.8 | 1.7 | 1 | - | - | - |
| Twin Hills Sulphide | |||||||||||||
| Indicated | 3.53 | 55 | 51 | 0.07 | 6.3 | 5.8 | 7 | ||||||
| Inferred | 1.49 | 46 | 43 | 0.05 | 2.2 | 2.1 | 3 | ||||||
| Subtotal | 5.02 | 53 | 49 | 0.06 | 8.5 | 7.8 | 10 | ||||||
| Mt Gunyan Oxide/Transition | |||||||||||||
| Indicated | 2.40 | 43 | 40 | 0.03 | 0.11 | 0.10 | - | 3.3 | 3.1 | 3 | 2.6 | 2.4 | - |
| Inferred | 1.47 | 38 | 35 | 0.04 | 0.12 | 0.18 | - | 1.8 | 1.7 | 2 | 1.7 | 2.7 | - |
| Subtotal | 3.87 | 41 | 39 | 0.03 | 0.11 | 0.13 | - | 5.1 | 4.8 | 5 | 4.3 | 5.0 | - |
| Mt Gunyan Sulphide | |||||||||||||
| Indicated | - | - | - | - | - | - | - | - | - | - | - | - | - |
| Inferred | 0.62 | 39 | 36 | 0.03 | 0.11 | 0.14 | - | 0.8 | 0.7 | 1 | 0.7 | 0.9 | - |
| Subtotal | 0.62 | 39 | 36 | 0.03 | 0.11 | 0.14 | - | 0.8 | 0.7 | 1 | 0.7 | 0.9 | - |
| Silver Spur Oxide | |||||||||||||
| Indicated | 0.03 | 78 | 67 | 0.08 | 1.53 | 0.48 | 0.05 | 0.1 | 0.1 | <1 | 0.4 | 0.1 | <0.1 |
| Inferred | 0.02 | 89 | 80 | 0.10 | 1.22 | 0.57 | 0.13 | 0.1 | 0.1 | <1 | 0.3 | 0.1 | <0.1 |
| Subtotal | 0.05 | 84 | 74 | 0.09 | 1.38 | 0.53 | 0.09 | 0.1 | 0.1 | <1 | 0.7 | 0.3 | <0.1 |
| Silver Spur Sulphide | |||||||||||||
| Indicated | 0.17 | 201 | 64 | 0.06 | 2.53 | 0.99 | 0.10 | 1.1 | 0.3 | <1 | 4.2 | 1.7 | 0.2 |
| Inferred | 0.45 | 148 | 49 | 0.06 | 1.91 | 0.59 | 0.09 | 2.1 | 0.7 | <1 | 8.6 | 2.6 | 0.4 |
| Subtotal | 0.02 | 162 | 53 | 0.06 | 2.08 | 0.70 | 0.09 | 3.2 | 1.0 | <1 | 12.8 | 4.3 | 0.6 |
| Texas District Totals | |||||||||||||
| Oxide-Transition Total | 5.00 | 44 | 41 | 37 | 0.10 | 0.11 | 0.00 | 7.0 | 6.6 | 6 | 5.0 | 5.3 | 0 |
| Sulphide Total | 6.26 | 62 | 47 | 55 | 0.22 | 0.08 | 0.01 | 12.5 | 9.5 | 11 | 13.5 | 5.2 | 0.6 |
| Texas District Total | 11.26 | 54 | 45 | 0.04 | 0.16 | 0.09 | 0.01 | 19.5 | 16.2 | 16 | 18.5 | 10.5 | 0.6 |
Note: The Twin Hills, Mt Gunyan and Silver Spur MRES use a 25 g/t Ag equivalent (AgEq) cut-off. The AgEq formula used the following processing recoveries: Twin Hills Ag 78%, Au 77%; Mt Gunyan oxide Ag 89%, Au 78%, Zn 12%; Mt Gunyan sulphide Ag 78%, Au 77%, Zn 16%; Silver Spur Oxide Ag 91%, Zn 20%; Silver Spur Sulphide Ag 69%, Zn 93%, Pb 64%. AgEq was calculated using the following formulas: Twin Hills (AgEq) = Ag (g/t)+65.22* Au g/t, Mt Gunyan Oxide AgEq = Ag (g/t) +57.91 * Au (g/t)+4.49* Zn(%), Mt Gunyan Sulphide AgEq= Ag (g/t)+65.22* Au (g/t)+6.84* Zn(%), Silver Spur Oxide AgEq = Ag (g/t) +7.3* Zn(%), Silver Spur Sulphide AgEq= Ag (g/t)+44.92 Zn(%) + 22.67* Pb (%) based on metal prices and metal recoveries into concentrate. Whilst the estimated contained gold for Silver Spur is shown here, it has not been included in the total gold ounces in the reported Mineral Resource as the quantity of contained gold is considered immaterial to the Mineral Resource. For all deposits the metal price assumptions used, where applicable, in the AgEq formula at an exchange rate of US$0.73 were; Ag price A$38/oz, Au price A$2,534/oz, Zn price A$4,110/t, Pb price A$3,014/t. Totals may not add up due to rounding.
| Cut off AgEq (g/t) | Tonners (Mt) | AgEq (g/t) | Ag (g/t) | Au (g/t) | Zn (%) | Pb (%) | Cu (%) | AgEq (Moz) | Ag (Moz) | Au (koz) | Zn (kt) | Pb (kt) | Cu (kt) |
|---|---|---|---|---|---|---|---|---|---|---|---|---|---|
| 0 | 0.80 | 132 | 46 | - | 1.82 | 0.58 | 0.08 | 3.4 | 1.2 | - | 14.6 | 4.7 | 0.6 |
| 10 | 0.71 | 148 | 52 | - | 1.97 | 0.65 | 0.09 | 3.4 | 1.2 | - | 13.9 | 4.6 | 0.6 |
| 20 | 0.68 | 154 | 54 | - | 2.01 | 0.68 | 0.09 | 3.4 | 1.2 | - | 13.5 | 4.6 | 0.6 |
| 25 | 0.66 | 156 | 54 | - | 2.03 | 0.69 | 0.09 | 3.3 | 1.2 | - | 13.5 | 4.6 | 0.6 |
| 30 | 0.65 | 159 | 55 | - | 2.06 | 0.70 | 0.09 | 3.3 | 1.2 | - | 13.4 | 4.5 | 0.6 |
| 40 | 0.63 | 164 | 57 | - | 2.11 | 0.72 | 0.10 | 3.3 | 1.2 | - | 13.2 | 4.5 | 0.6 |
| 50 | 0.59 | 171 | 60 | - | 2.19 | 0.76 | 0.10 | 3.2 | 1.1 | - | 12.9 | 4.5 | 0.6 |
| 60 | 0.55 | 181 | 64 | - | 2.28 | 0.81 | 0.11 | 3.2 | 1.1 | - | 12.4 | 4.4 | 0.6 |
| 70 | 0.51 | 188 | 67 | - | 2.36 | 0.86 | 0.11 | 3.1 | 1.1 | - | 12.1 | 4.4 | 0.6 |
| 80 | 0.48 | 197 | 70 | - | 2.45 | 0.91 | 0.12 | 3.0 | 1.1 | - | 11.7 | 4.3 | 0.5 |
| 90 | 0.44 | 205 | 73 | - | 2.55 | 0.95 | 0.12 | 2.9 | 1.0 | - | 11.3 | 4.2 | 0.5 |
| 100 | 0.42 | 213 | 76 | - | 2.63 | 0.98 | 0.12 | 2.8 | 1.0 | - | 10.9 | 4.1 | 0.5 |
| 110 | 0.38 | 222 | 79 | - | 2.74 | 1.03 | 0.13 | 2.7 | 1.0 | - | 10.4 | 3.9 | 0.5 |
| 120 | 0.35 | 232 | 83 | - | 2.84 | 1.08 | 0.13 | 2.6 | 0.9 | - | 9.9 | 3.8 | 0.5 |
| Cut off AgEq (g/t) | Tonners (Mt) | AgEq (g/t) | Ag (g/t) | Au (g/t) | Zn (%) | Pb (%) | Cu (%) | AgEq (Moz) | Ag (Moz) | Au (koz) | Zn (kt) | Pb (kt) | Cu (kt) |
|---|---|---|---|---|---|---|---|---|---|---|---|---|---|
| 0 | 116.20 | 6 | 5 | 0.01 | 0.06 | 0.03 | - | 23.3 | 20.4 | 30 | 64.8 | 33.2 | - |
| 10 | 22.85 | 19 | 18 | 0.02 | 0.11 | 0.07 | - | 14.2 | 13.0 | 13 | 24.6 | 16.6 | - |
| 20 | 6.44 | 35 | 33 | 0.03 | 0.10 | 0.12 | - | 7.3 | 6.8 | 6 | 6.6 | 7.4 | - |
| 25 | 4.50 | 41 | 38 | 0.04 | 0.11 | 0.13 | - | 5.9 | 5.5 | 5 | 5.0 | 5.9 | - |
| 30 | 3.10 | 47 | 44 | 0.05 | 0.12 | 0.15 | - | 4.7 | 4.4 | 5 | 3.8 | 4.6 | - |
| 40 | 1.47 | 61 | 56 | 0.08 | 0.16 | 0.15 | - | 2.9 | 2.6 | 4 | 2.3 | 2.2 | - |
| 50 | 0.77 | 76 | 69 | 0.11 | 0.20 | 0.16 | - | 1.9 | 1.7 | 3 | 1.5 | 1.2 | - |
| 60 | 0.43 | 93 | 83 | 0.15 | 0.24 | 0.17 | - | 1.3 | 1.2 | 2 | 1.0 | 0.7 | - |
| 70 | 0.26 | 113 | 101 | 0.18 | 0.21 | 0.17 | - | 0.9 | 0.8 | 1 | 0.5 | 0.4 | - |
| 80 | 0.19 | 127 | 114 | 0.20 | 0.20 | 0.17 | - | 0.8 | 0.7 | 1 | 0.4 | 0.3 | - |
| 90 | 0.13 | 145 | 130 | 0.24 | 0.21 | 0.17 | - | 0.6 | 0.6 | 1 | 0.3 | 0.2 | - |
| 100 | 0.09 | 165 | 151 | 0.23 | 0.23 | 0.16 | - | 0.5 | 0.5 | 1 | 0.2 | 0.2 | - |
| 110 | 0.07 | 184 | 171 | 0.20 | 0.26 | 0.16 | - | 0.4 | 0.4 | 0 | 0.2 | 0.1 | - |
| 120 | 0.06 | 196 | 184 | 0.19 | 0.28 | 0.15 | - | 0.4 | 0.4 | 0 | 0.2 | 0.1 | - |
Note: These results were originally published in February 2022 as an ASX announcement by the previous owners. Since then, Silver Star has conducted a comprehensive desktop review of the resource estimates, revealing that the recent resource downgrade in June 2021 overlooked several significant factors.
With our current drilling program, we are undertaking an extensive infill drilling and twinning initiative aimed at upgrading those resources. We anticipate a swift return to the original estimate of 26 million ounces of silver equivalent under JORC compliance, with the potential for significant resource expansion.
Notably, during the ongoing drilling program, we have identified substantial high-grade discoveries around the original crushing plant location. These discoveries offer the opportunity to expand the pit and significantly increase resources. Additionally, exploratory wildcat drilling in high-grade areas, supported by previous exploration work and promising rock chip sample results, indicates exceptional potential for further resource growth.
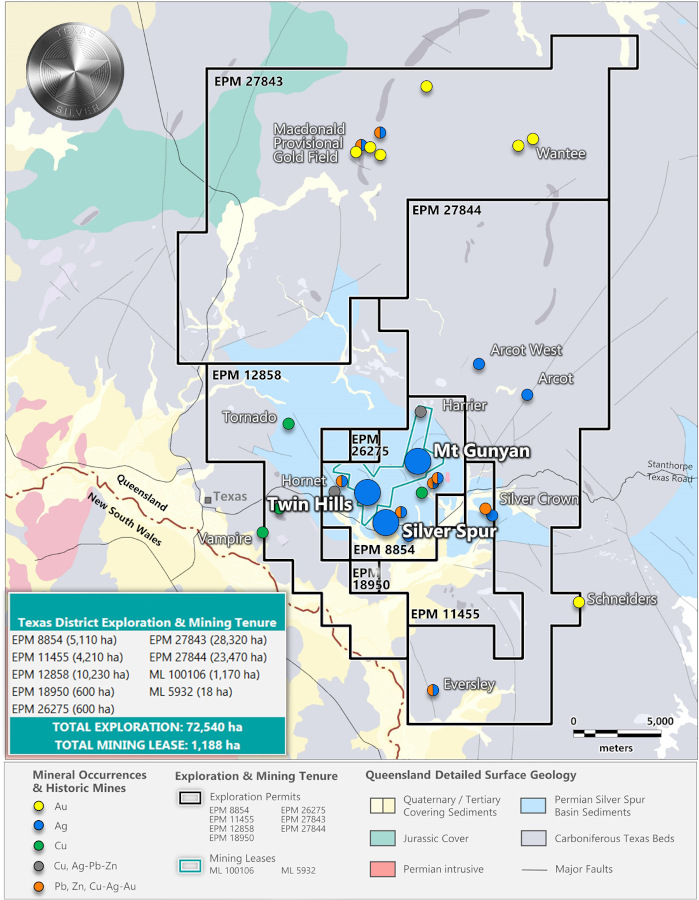
The accompanying map and table provide further detail on these findings.
| Tenure ID | Project Name | Granted |
|---|---|---|
| EPM 11455 | Dumaresq | 1/04/2023 |
| EPM 12858 | Oakey Creek | 10/08/2023 |
| EPM 18950 | Texas South West | 31/05/2021 |
| EPM 26275 | Texas Silver | 27/02/2022 |
| EPM 27843 | Macdonald | 18/10/2021 |
| EPM 27844 | Arcot | 18/10/2021 |
| EPM 8854 | Texas | 8/07/2023 |
| ML 100106 | Texas | 1/10/2017 |
| ML 5932 | Silver Spur | 5/06/2016 |
Thomson Resources Ltd. ASX Announcement of 1 March 2022
Valuing the cost of past drilling and exploration on a historical silver mine involves several steps:

Gather detailed records of all past drilling and exploration activities, including dates, methods and locations.

Add up all direct costs associated with these activities, such as labour, equipment, materials and contractor services.

Use historical cost indexes to adjust past costs to present-day values.

Consider indirect costs like permitting, logistical support and administrative expenses.

Through this acquisition, Texas Silver has secured comprehensive historical drill data and associated analysis from over 731 drilling sites, totaling a depth of 41,952 meters. This data, collected across multiple exploration programs, will be meticulously modelled to identify the best potential future exploration prospects. Many of the leases have been the subject of early stage, and advanced exploration. As such, over 20 areas of interest have been identified as containing indications of high-grade silver and copper, with additional early indications of gold, lead and other metals on the critical minerals list that need to be investigated.
The JORC 2012 Mineral Resource Estimates (MREs) for the Silver Spur, Twin Hills, and Mt Gunyan deposits total an aggregate of 19.5 Moz AgEq at 54 g/t AgEq.
Reference ASX Announcement of 1 March 2022 Thomson Resources Ltd. – “19.5 Moz Silver Equivalent Indicated and Inferred Mineral Resource Estimate for the Texas Silver District.”
The majority of holes and meterage are from open hole percussion drilling, which may impact sample quality. Assay methods used include aqua regia digest with AA or ICP finish, which, while potentially partial, may be appropriate for heap leaching.
Both models use a 20g/t Ag grade threshold for interpretation, though a high-grade domain at 40g/t Ag may have been used in 2016. The threshold being close to the cut-off grade may be inappropriate.
2016 - "Some 200 meters vertically from surface" 2022 - "Extending to 150 meters depth" but also mentions a "200 meters depth limit below surface," which is ambiguous.

| Grade | Contained Metal | ||||||||||||
|---|---|---|---|---|---|---|---|---|---|---|---|---|---|
| Texas District Deposits | Tonnes (MT) | AgEq (g/t) | Ag (g/t) | Au (g/t) | Zn (%) | Pb (%) | Cu (%) | AgEq (Moz) | Ag (Moz) | Au (koz) | Zn (kt) | Pb (kt) | Cu (kt) |
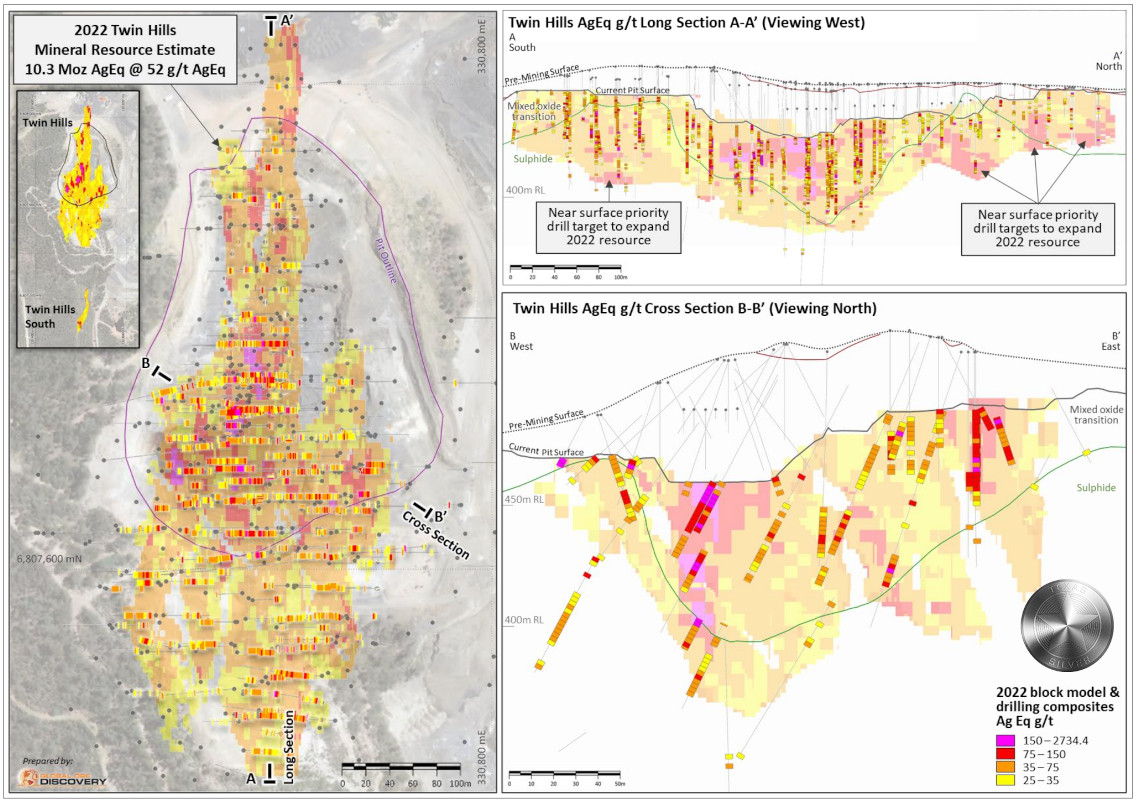
| Twin HIlls ML 100106 | |||||||||||||
| Indicated | 4.43 | 55 | 51 | 0.06 | - | - | - | 7.8 | 7.3 | 9 | - | - | - |
| Inferred | 1.67 | 45 | 42 | 0.05 | - | - | - | 2.4 | 2.2 | 3 | - | - | - |
| Subtotal | 6.10 | 52 | 48 | 0.06 | - | - | - | 10.3 | 9.5 | 11 | - | - | - |
| Mount Gunyan ML 100106 | |||||||||||||
| Indicated | 2.40 | 43 | 40 | 0.03 | 0.11 | 0.10 | - | 3.3 | 3.1 | 3 | 2.6 | 2.4 | - |
| Inferred | 2.09 | 39 | 36 | 0.04 | 0.12 | 0.17 | - | 2.6 | 2.4 | 3 | 2.4 | 3.6 | - |
| Subtotal | 4.5 | 41 | 38 | 0.04 | 0.11 | 0.13 | - | 5.9 | 5.5 | 5 | 5.0 | 5.9 | - |
| Silver Spur ML 5932 | |||||||||||||
| Indicated | 0.19 | 184 | 65 | 0.6 | 2.40 | 0.92 | 0.09 | 1.1 | 0.4 | < 1 | 4.6 | 1.8 | 0.2 |
| Inferred | 0.47 | 145 | 50 | 0.6 | 1.88 | 0.59 | 0.09 | 2.2 | 0.8 | < 1 | 8.9 | 2.8 | 0.4 |
| Subtotal | 0.66 | 156 | 54 | 0.6 | 2.03 | 0.69 | 0.09 | 3.3 | 1.2 | < 1 | 13.5 | 4.6 | 0.6 |
| Total Indicated | 7.02 | 54 | 48 | 0.05 | 0.10 | 0.06 | 0.00 | 12.2 | 10.8 | 12 | 7.2 | 4.2 | 0.2 |
| Total Inferred | 4.23 | 53 | 40 | 0.04 | 0.27 | 0.15 | 0.01 | 7.2 | 5.4 | 6 | 11.3 | 6.4 | 0.2 |
| Texas District Total | 11.26 | 54 | 45 | 0.04 | 0.16 | 0.09 | 0.01 | 19.5 | 16.2 | 16 | 18.5 | 10.5 | 0.6 |

The Texas Prospects have yielded rock samples with significant AgEQ values, showcasing the potential of the region’s mineral resources. These results highlight the area’s prospectively and underscore its potential for further exploration and development. The data provides a strong foundation for advancing the Silver Star Project and supports our strategic focus on unlocking the site’s value.


Note: These recalculated figures provide a comprehensive overview of the drilling costs, taking into account both direct and indirect expenses.
Collect detailed records of drilling and exploration activities, including dates, methods, and specific locations for the 731 sites.
Use historical cost indexes to adjust past costs to present-day values. For example, if the average cost per meter drilled in the past was $150, adjusting for inflation might increase this to $320 per metre today.
Current market price of silver: ~115 AUD / oz
Current resources to JORC 19.5 million ounces. Reduce the net resources allowing for a 50% recovery rate (recovery rate is what is captured during production).Multiply the net in-ground resources by the market price of silver.
Use historical cost indexes to adjust past costs to present-day values.
Subtract the total extraction costs from the gross value to get the net value of the resources.
Apply a discount rate to account for the time value of money, operational risks, and uncertainties. Contingency factor of 10%.

Gross Value of the net Resources: 409.5 million AUD.
Total Extraction Cost with Contingency: 375.375 million AUD.
Net Value After Extraction Costs: 34.125 million AUD.